
News Category
Product Category
Since October this year, central authorities and the Photovoltaic Industry Association have taken more comprehensive measures to promote the healthy and orderly development of China's photovoltaic industry. These measures include reducing export tax rebates, revising stricter capacity management regulations, periodically publishing cost reference prices for each segment of the value chain, signing a self-discipline covenant, and implementing quota-based production limits.
Some have compared the 33 photovoltaic companies that signed the covenant to an "OPEC" for the PV industry, and the closed-door meeting held during the PV Industry Conference on December 5 to a "Zunyi Meeting" for the sector. So, how effective was OPEC in its heyday, and what lessons can be learned from it? How have traditional domestic industries resolved supply-demand contradictions in the past? What outcomes might the current series of measures to limit production, prices, and new capacity bring? In this edition, we will take an in-depth look at OPEC, steel, and photovoltaics.
Let's turn the clock back to the 1950s and 1960s.
After World War II, the economies of Europe, the United States, and Japan gradually accelerated, leading to a significant increase in oil consumption. However, oil-producing developing countries in the Middle East and Latin America did not reap corresponding profits. This was because oil prices were controlled by major oil companies (such as the "Seven Sisters")—firms from the United States, the United Kingdom, the Netherlands, and other nations that monopolized oil exploration, extraction, and sales. Developing countries were in a weak position in the oil market, lacking control over resource pricing.
As a result, in 1960, Saudi Arabia, Iran, Iraq, Kuwait, and Venezuela founded the Organization of the Petroleum Exporting Countries (OPEC) in Baghdad. Today, OPEC includes dozens of oil-producing countries from Asia, Africa, and Latin America.
Let's briefly review OPEC's historical trajectory.
Although OPEC was founded to unite oil-exporting countries and coordinate oil production and prices, member states initially lacked a unified strategy. Many had different levels of oil production, economic development, and political interests.
This began to change in the early 1970s.
Against the geopolitical backdrop of the Cold War, the Arab world's unity increased significantly. Particularly amid the conflict between Israel and Arab countries, oil became a political tool. In October 1973, the Arab-Israeli war broke out (involving Egypt and Syria). OPEC immediately imposed an oil embargo, reducing exports, especially to the United States, the Netherlands, and other supporters of Israel. In December 1973, Arab members announced they would take back control of crude oil pricing, raising the benchmark price from $3.011 per barrel to $10.651 per barrel—more than tripling it. This had a huge impact on the global economy; Western industrialized countries experienced severe stagflation, and OPEC demonstrated powerful market control for the first time.
Then, in 1979, revolution broke out in Iran, the second-largest oil exporter. The new government's nationalization of the oil industry led to a sharp drop in Iranian production. OPEC again limited production to push up prices, but internal disagreements emerged, mainly between Saudi Arabia and smaller producers over output and price policies. These differences widened in the 1980s. OPEC failed to agree on unified production targets, leading to market imbalances. Some members began producing above their quotas, causing oil prices to fall.
From the 1990s until the 2008 financial crisis, as the Cold War ended and emerging markets like China and India rose, OPEC moderately increased production to meet demand. However, competition from non-OPEC countries like Russia and Mexico intensified. Yet due to strong demand, oil prices generally rose with fluctuations.
The 2008 economic crisis caused a sharp drop in oil prices, but afterwards, the US shale revolution greatly increased American production capacity. The US became a major global oil producer, gradually taking market share from OPEC. Meanwhile, internal OPEC tensions grew, especially between Saudi Arabia and Iran. In 2016, OPEC reached a cooperation agreement with non-OPEC countries (especially Russia) to jointly reduce production to address long-term low prices.
Entering 2020, the pandemic again impacted the global economy, causing demand to collapse. OPEC+ reached a historic production cut agreement in 2020, reducing output by 9.7 million barrels per day. At the same time, the global energy transition and the rise of renewable energy have presented new challenges to OPEC. Its influence today is vastly different from what it was in 1973.
We can see that it may not be appropriate to directly compare OPEC to the PV self-discipline alliance—there are many differences.
First, OPEC is an intergovernmental organization backed by national credit; breaching agreements has high costs, and actions are more cautious. Second, in terms of resource attributes, oil supply is easier to control than polysilicon. If you stop extracting oil, the resource remains underground and does not deplete. But if you stop producing polysilicon, existing production lines risk being scrapped. Moreover, oil resources are highly concentrated, essential, and monopolistic. The number of member states is small, but their market share is large, making it relatively easier to implement specific measures.
Nevertheless, there are valuable lessons from OPEC's history.
Any organization or alliance consists of multiple members, and there is often a dominant member (like Saudi Arabia in OPEC). However, because each member has different circumstances and interests, reaching consensus is easier than concrete implementation. Over the past six decades, except for the extreme situation in 1973, there have always been varying degrees of disagreement within OPEC. Add to that the entry of external players (e.g., Russia, Mexico), the impact of technological innovation (e.g., the US shale revolution), and fundamental strategic shifts (e.g., the global energy transition in recent years), it has been very difficult for the organization to achieve meaningful results.
These points are worth pondering when it comes to the PV self-discipline alliance. Reaching a consensus on unified production cuts to improve supply-demand is easy, but there are internal disagreements on how much each upstream player should cut, how to allocate capacity, how to control downstream prices, and how to resolve differences between leaders and second/third-tier companies in bidding. Not to mention, if supply-demand improves in the future and prices rise across the value chain, will the alliance face internal fragmentation? After all, these are "wartime" measures of limiting production and prices, much like after the 1973 oil crisis.
Thus, reaching consensus and signing a self-discipline covenant is only the first step toward improving supply-demand dynamics in the industry. The road ahead will be more complex.
The OPEC example may not be sufficiently "local"—after all, it happened on the other side of the world, with different regional, cultural, and international political contexts. So, let's look at the history of capacity clearance in domestic industrial manufacturing. Traditional energy, ferrous metals, and construction materials are the most typical examples, including coal, steel, cement, glass, etc. Here, we'll take steel as an example.
The mid-1990s marked the beginning of two decades of rapid urbanization growth in China, with steel production capacity and output rising quickly. Coupled with large-scale infrastructure development after the 2008 financial crisis, the steel industry expanded excessively, and output continued to climb. In 2000, China's crude steel capacity was only 130 million tons, but just eight years later, it exceeded 500 million tons—tripling—and peaked at 1.13 billion tons in 2014–2015.
As early as 2013, the Ministry of Industry and Information Technology (MIIT) published the first list of companies in 19 industrial sectors to phase out outdated capacity, including 24 steel companies in Shandong, Hebei, Chongqing, and elsewhere. However, this did not slow capacity expansion.
The pace of capacity expansion continued until 2015.
That year, steel prices fell sharply, the entire industry suffered losses, severe overcapacity emerged, and vicious competition spread. At the Central Economic Work Conference at the end of 2015, the central government made it clear for the first time that supply-side structural reforms should be carried out in the coal and steel industries, officially beginning the process of reducing steel capacity.
In 2016, the State Council issued the "Opinions on Resolving Overcapacity and Achieving Development through Difficulties in the Steel Industry," explicitly stating that "no new steel capacity projects may be registered in any name or form." New projects had to go through capacity replacement. The document also set a five-year goal to eliminate 100–150 million tons of excess steel capacity, roughly 10% of existing capacity. That same year, the Ministry of Finance issued the "Measures for the Management of Special Award and Subsidy Funds for Industrial Enterprise Structural Adjustment," providing supporting policies for eight areas: awards and subsidies for reducing coal and steel overcapacity, fiscal and tax support, financial support, employee resettlement, land, environmental protection, quality, and safety, thereby optimizing the capacity exit mechanism.
In 2017, policies were further strengthened. The National Development and Reform Commission (NDRC) and MIIT jointly issued a notice on using pricing mechanisms to promote supply-side structural reform in the steel industry. The notice raised production costs for steel companies through stricter differential electricity pricing and tiered electricity pricing based on process energy consumption, accelerating the elimination of outdated capacity. That same year, multiple steel industry associations jointly issued opinions supporting the crackdown on "substandard steel" and defining the scope of induction furnaces. The State Council established a joint law enforcement inspection team to directly eliminate outdated "substandard steel" capacity.
Through multiple efforts, this set of policy measures achieved significant results between 2016 and 2018. In 2016, 65 million tons of excess capacity were eliminated; in 2017, 55 million tons; in 2018, 30 million tons. The 150-million-ton target was met two years ahead of schedule, and steel prices returned to 2012–2013 levels.
The good times did not last long. As steel prices rose and enforcement of violations eased, many previously shut-down capacities resumed production. Coupled with the gradual release of capacity already under construction, China's crude steel output rebounded from 2019 to 2020, nearly returning to 1.1 billion tons, with prices slowly falling again. At the end of 2020, with the introduction of carbon peak and carbon neutrality goals, MIIT and other authorities once again cracked down on illegal new capacity, non-standard capacity replacement, and high-energy-consuming, inefficient, non-environmentally friendly capacity. Since then, the trend of steel capacity and output in China has gradually slowed.
What does the future hold for the steel industry? Let's look at Japan for reference.
After World War II, Japan's economy was almost in ruins. From the mid-1950s, Japan entered a period of rapid growth, and its industrial manufacturing recovered. By the 1960s, Japan had become the world's second-largest economy, with key industries such as steel, automobiles, and electronics gradually becoming world-leading. After the first oil crisis in 1973, Japan had no choice but to adjust its industrial structure, developing high-value-added, technology-intensive industries (e.g., electronics, automobiles, robotics). Automobiles and electronics became export pillars, while domestic traditional industrial manufacturing slowed from then on.
We examined historical annual crude steel output for China and Japan. In Japan, after rapid development in the 1960s and 1970s, crude steel output peaked in 1973, then entered a long period of plateau volatility. During this period, downstream industries—construction, infrastructure, and machinery—had already passed their high-growth phases. The steel industry entered a mature stage, with limited future demand. In fact, China is currently experiencing this same phase.
The capacity clearance in the steel industry offers at least two insights.
First, the degree of involvement by central authorities.
We can see that from 2016 to 2017, central authorities, together with other departments and industry associations, achieved immediate results in eliminating outdated capacity through measures such as setting quantitative targets, strictly controlling new capacity, optimizing exit mechanisms, limiting electricity pricing to force out high-energy-consumption capacity, and targeting specific outdated capacities.
Comparing this to the photovoltaic industry, MIIT has revised the "Photovoltaic Manufacturing Industry Standard Conditions (2024 Edition)" and management measures, strictly controlling the entry of new capacity through more stringent quantitative indicators. At the same time, MIIT, together with the NDRC and the State-owned Assets Supervision and Administration Commission (SASAC), has officially certified cost reference prices issued by the Photovoltaic Industry Association. Additionally, the General Administration of Customs has reduced export tax rebates to discourage the capacity of second- and third-tier companies that focus on overseas markets and rely on rebate subsidies.
Of course, the authorities have not characterized the PV industry as having "excess capacity," but rather a temporary mismatch. The core reason is that, with the end of urbanization and large-scale infrastructure development, the steel industry has entered a mature phase, while the PV industry has only been four years since achieving grid parity in 2020. The future market space still exists, and the industry is in a volume-growth stage. Therefore, using China's steel industry as a perfect analogy for photovoltaics is also not entirely appropriate. Thus, some tough measures—such as setting specific clearance targets, the Ministry of Finance providing exit guarantees, and directly restricting electricity prices—will not be introduced at this stage. Guided by the authorities, we are instead relying on industry associations and companies themselves to find a path forward, often one step at a time. This may truly be a case of, as the industry association said, "If you walk alone, you can go fast; if you walk together, you can go far." The PV industry still has a considerable way to go to achieve true supply-demand balance.
Second, what happens after the first round of excess capacity exit.
The polysilicon industry, like the steel industry, is asset-heavy, and the capital invested involves the interests of many parties. After a phased production halt, capacity is not necessarily truly eliminated. Even corporate bankruptcy and liquidation often only lead to the transfer of production machinery, not its annihilation. In other words, capacity clearance can be followed by reversals, and so-called "zombie capacity" will exist.
There is a saying in the PV industry: if a polysilicon production line is shut down for one year but properly maintained, it can fully resume production. Let's do a rough calculation: with an annual industry capacity of 290,000 tons and an average operating rate of 45%, current monthly polysilicon production is 108,800 tons. Based on an estimated 600 GW of component demand in 2025, the corresponding monthly polysilicon demand is 100,000 tons. In terms of inventory, by the end of 2024, the industry's polysilicon inventory was approximately 270,000–280,000 tons, equivalent to 2–3 months of consumption. If we exclude trader holdings and one month of reserve stock, the amount of polysilicon that needs to be destocked is around 150,000 tons. On December 24, Tongwei and Daqo both announced production reduction plans. Their combined capacity is 1.2 million tons. If their reductions bring the industry's average operating rate down to 35%, monthly output would drop to 84,600 tons, meaning the 150,000 tons of polysilicon requiring destocking would take about ten months to clear. If destocking is completed by the end of 2025, these temporarily shut-down capacities could still resume production. If prices rise sharply by then, polysilicon capacity could rebound again.
Of course, some small and medium-sized capacity has already been idle since the second half of 2024, and 600 GW is just a neutral demand forecast. If future PV installations continue to grow, the supply-demand contradiction could still be effectively alleviated. In reality, that will be a story for the second half of 2025. What needs to be watched in the near term is whether the quota-based production limits in the first half of 2025 are properly implemented. Good control of upstream output will gradually transmit to downstream modules, further curbing the chaos of low-price bidding.
 Heavy-Duty Roller Linear Guide Profiles
 Heavy-Duty Linear Guide Profiles
 Low-Profile Linear Guide Profiles
 Precision Hardened Linear Guide Profiles with Mounting Holes
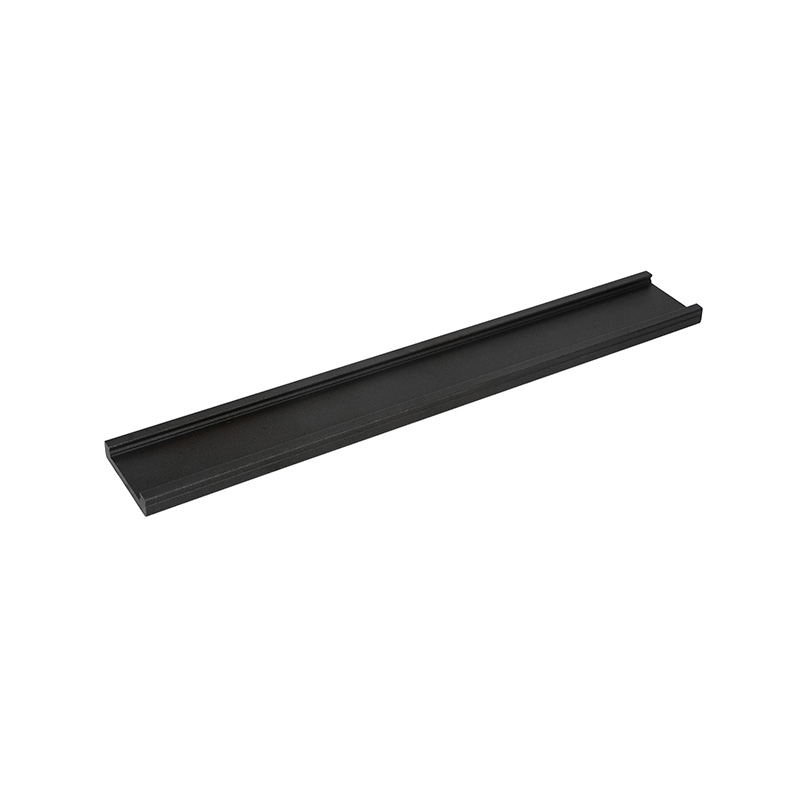 Custom Linear Guide Profiles
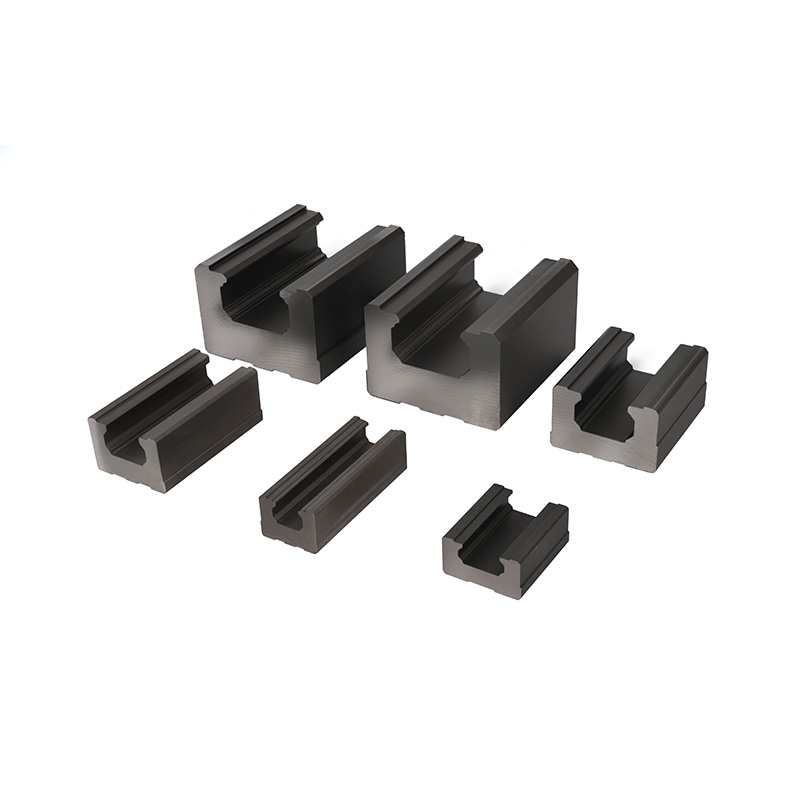 Square Linear Guide Block Profiles
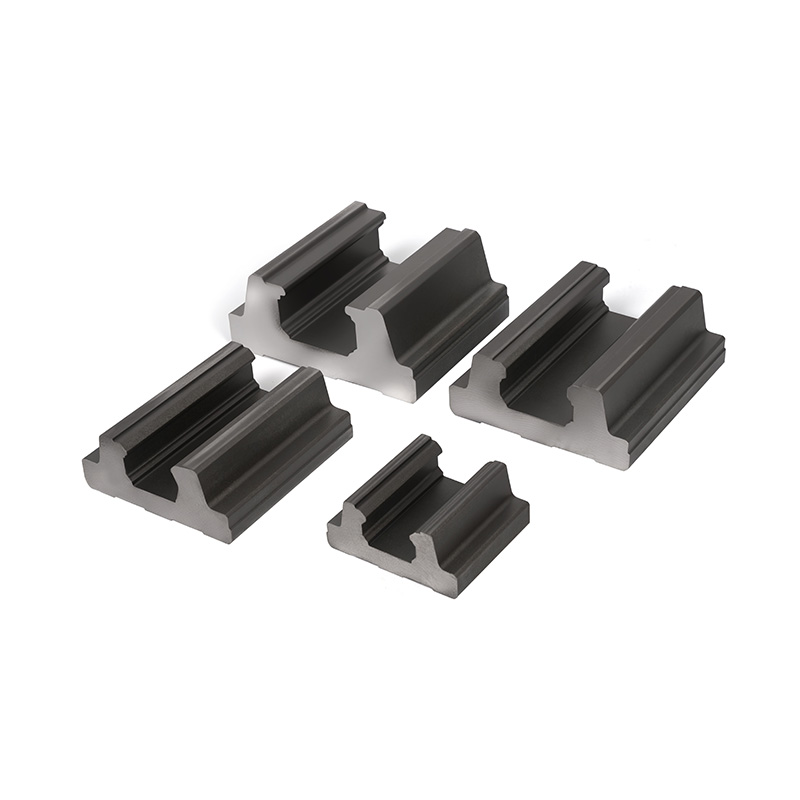 Flange-Type Guide Block Profiles
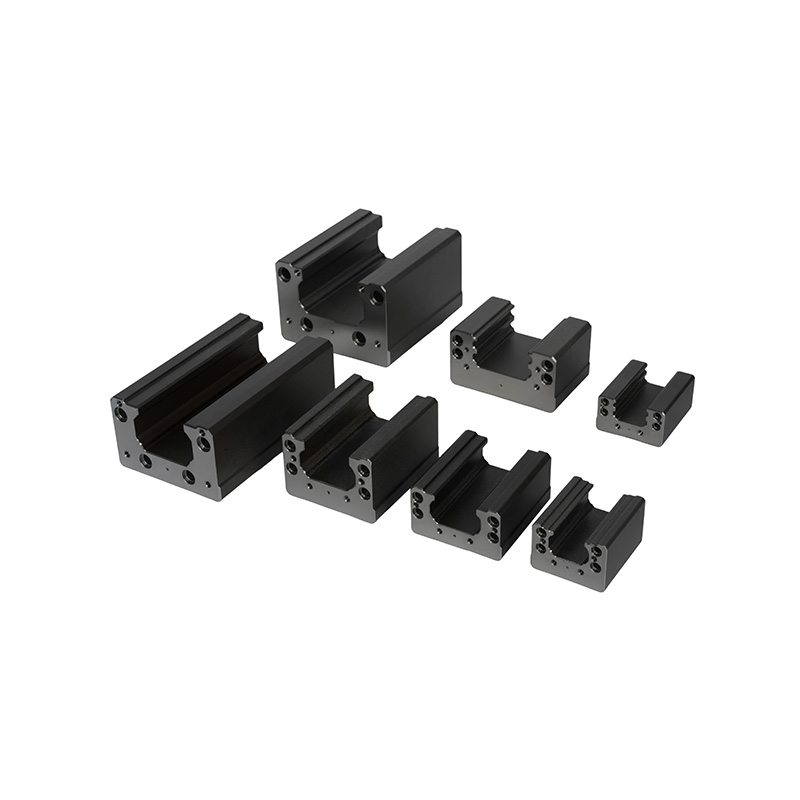 Precision-Machined Linear Guide Blocks



 English
 中文简体
中文简体 Español